If you have ever faced a moment of uncertainty in your relationship and wondered
where are we, where is this going?, am I even happy?,
Glass Heart provides you with a clear vision of your true feelings.
where are we, where is this going?, am I even happy?,
Glass Heart provides you with a clear vision of your true feelings.
Concept
Love may be a mysterious force but your emotions and reactions are concrete and measurable. Monitoring them grants the opportunity to unveil patterns and understand emotions that may be tainted by the lense of time, denial or idealization. The aim of this mobile application is to cast light into the relationships that nurture us and detect those that are detrimental to our well-being.
Functioning
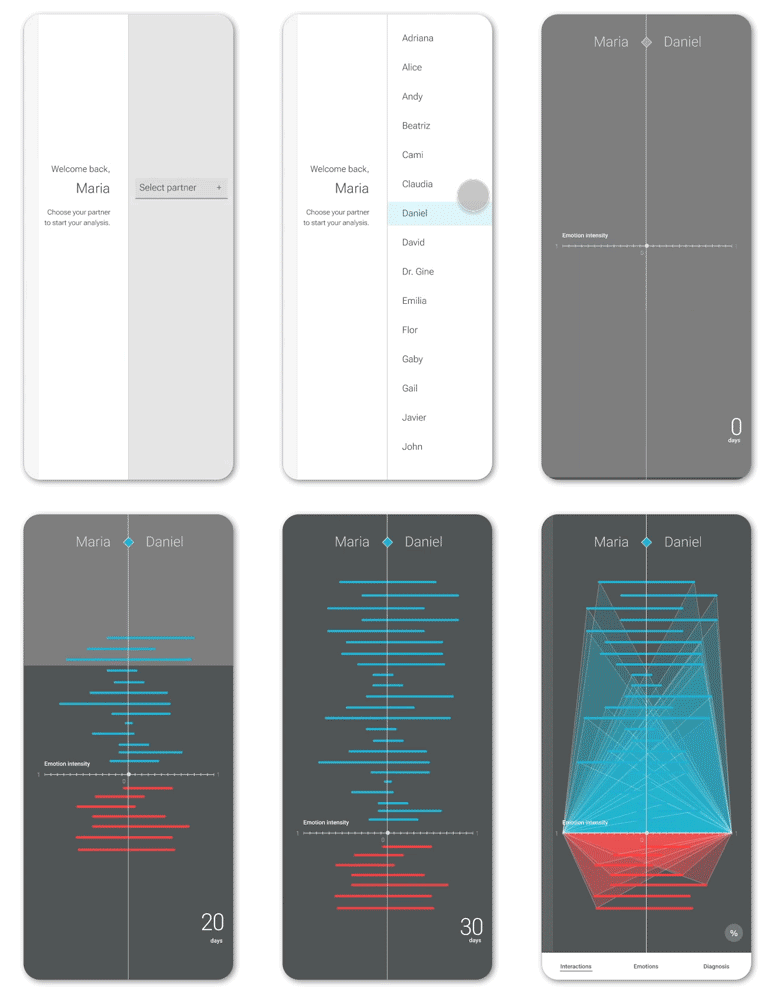
The application feeds from text and voice messages between partners for a span of 30 days. These get analyzed through sentiment analysis, to be then categorized and displayed in two classes: Positive charge (blue) and Negative charge (red). For a better comprehension of interactions, these are also grouped according to personality traits from the Big Five Model (OCEAN).
User Experience
Set up your tracking
As simple as selecting your partner from your contact list will start the process of tracking the messages exchanged within the relationship. Once finalized, you obtain the Overview and your Glass Heart.
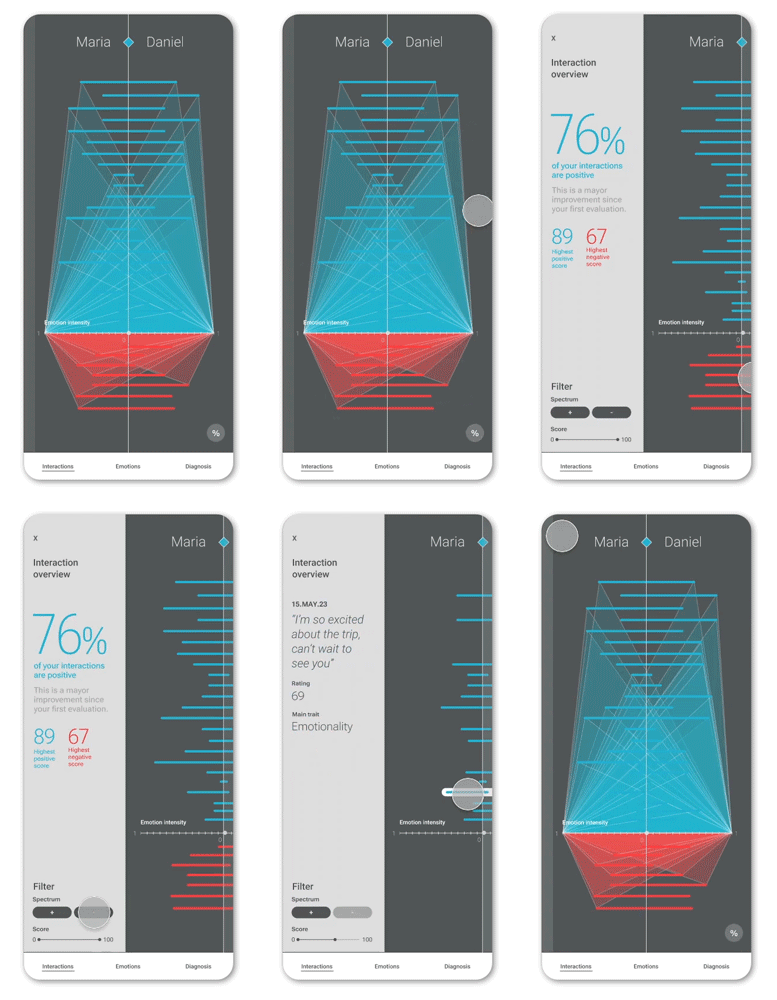
Explore your interactions
Besides de General Overview, you can look deeper into the specific interaction units, see the original messages and their positivity or negativity charge.
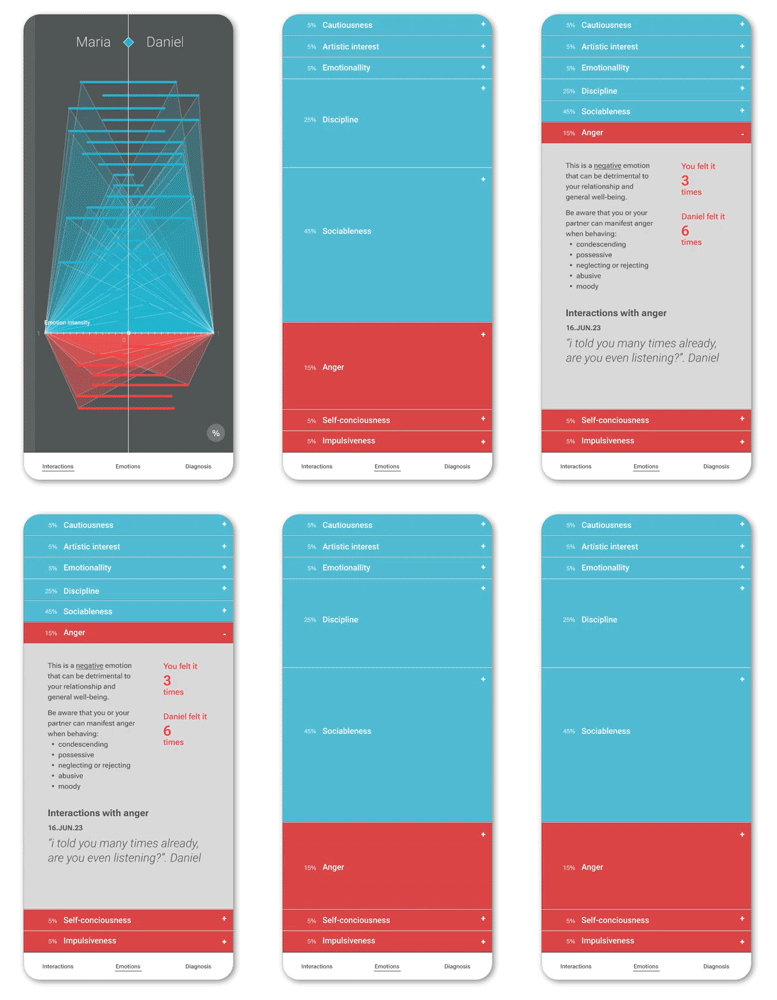
Discover your emotions
You may observe detailed information about actual emotions or traits that manifested in the collecting period.
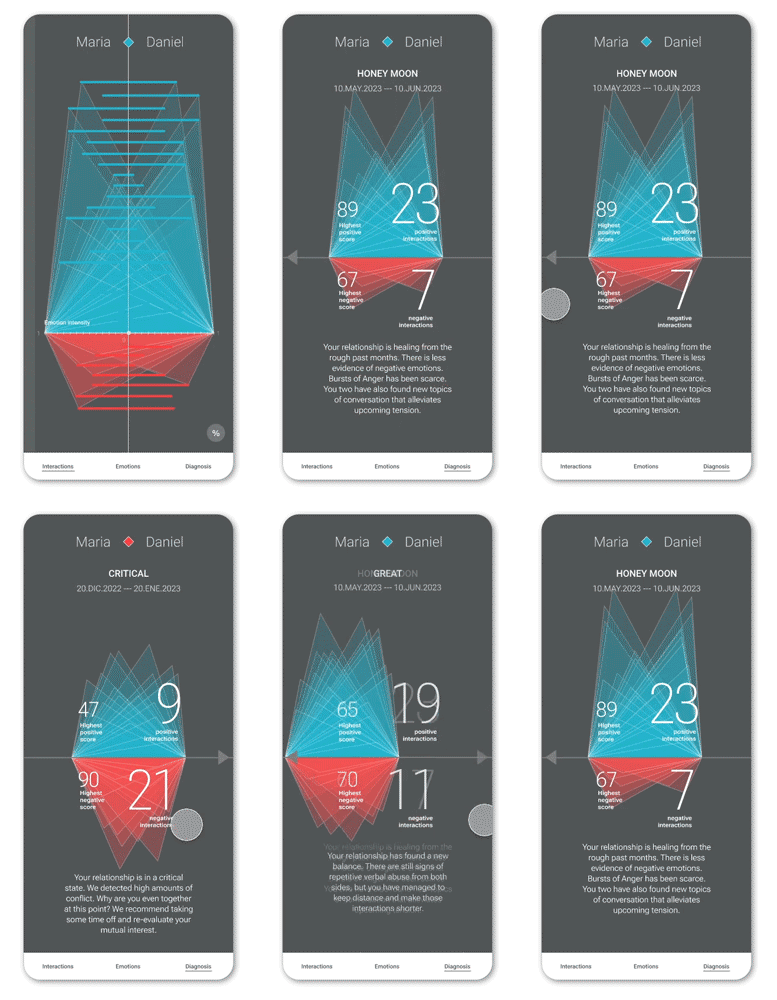
Check your history diagnosis
A summary of your behavior and a historical comparisson with your previous diagnosis. Words of advice or encouragement can be found here.
Visualization system
Interactions are collected and processed with the users' data. They are displayed in form of linear segments on a coordinates plane system according to its score and category.
Distribution of Interactions
They are located in either of the hemispheres, corresponding to what kind of charge they have. They pile up chronologically, both up→down and down→up directions, being the center the place where first interactions go.
Axes
Repeating this mirror logic, the vertical axis will serve as the origin of the scale to draw the intensity of the charge. The growth to the left side corresponds to the score given by the Partner 1, likewise to the right side, where the score is assigned by the Partner 2.
Drawing hearts
The lines serve as the baselines to draw peak planes that shape the Hearts. They grow from the horizontal axis, peaking at the highest scores per interaction. By overlapping these translucid color planes, we can appreciate the density of the charges in a bolder way, understand what kind of sentiment each partner is experiencing the most, and the general satisfaction of the relationship.
Heart cases
Case 1
This representation shows an a great density of negative feelings with growth of intesity through time, as the positive drive decreases in the most recent interactions.
This representation shows an a great density of negative feelings with growth of intesity through time, as the positive drive decreases in the most recent interactions.
Case 2
We can observe not only a great positive load, but also great intensity of feelings. Nontheless, Partner 1 is experiencing deep negative emotions.
We can observe not only a great positive load, but also great intensity of feelings. Nontheless, Partner 1 is experiencing deep negative emotions.
The Perfect Heart
Numerous positive peaks on both partner's sides and, in sum, slightly more that the negative portion. It is innevitable to experience negative feelings, but keeping them at a lowintesity is ideal, hence the peaks that grow closer to the horizontal middle.
Development: Ideation, UX and UI, Visualization system
This work is licensed under a Creative Commons Attribution-NonCommercial-NoDerivatives 4.0 International License.
